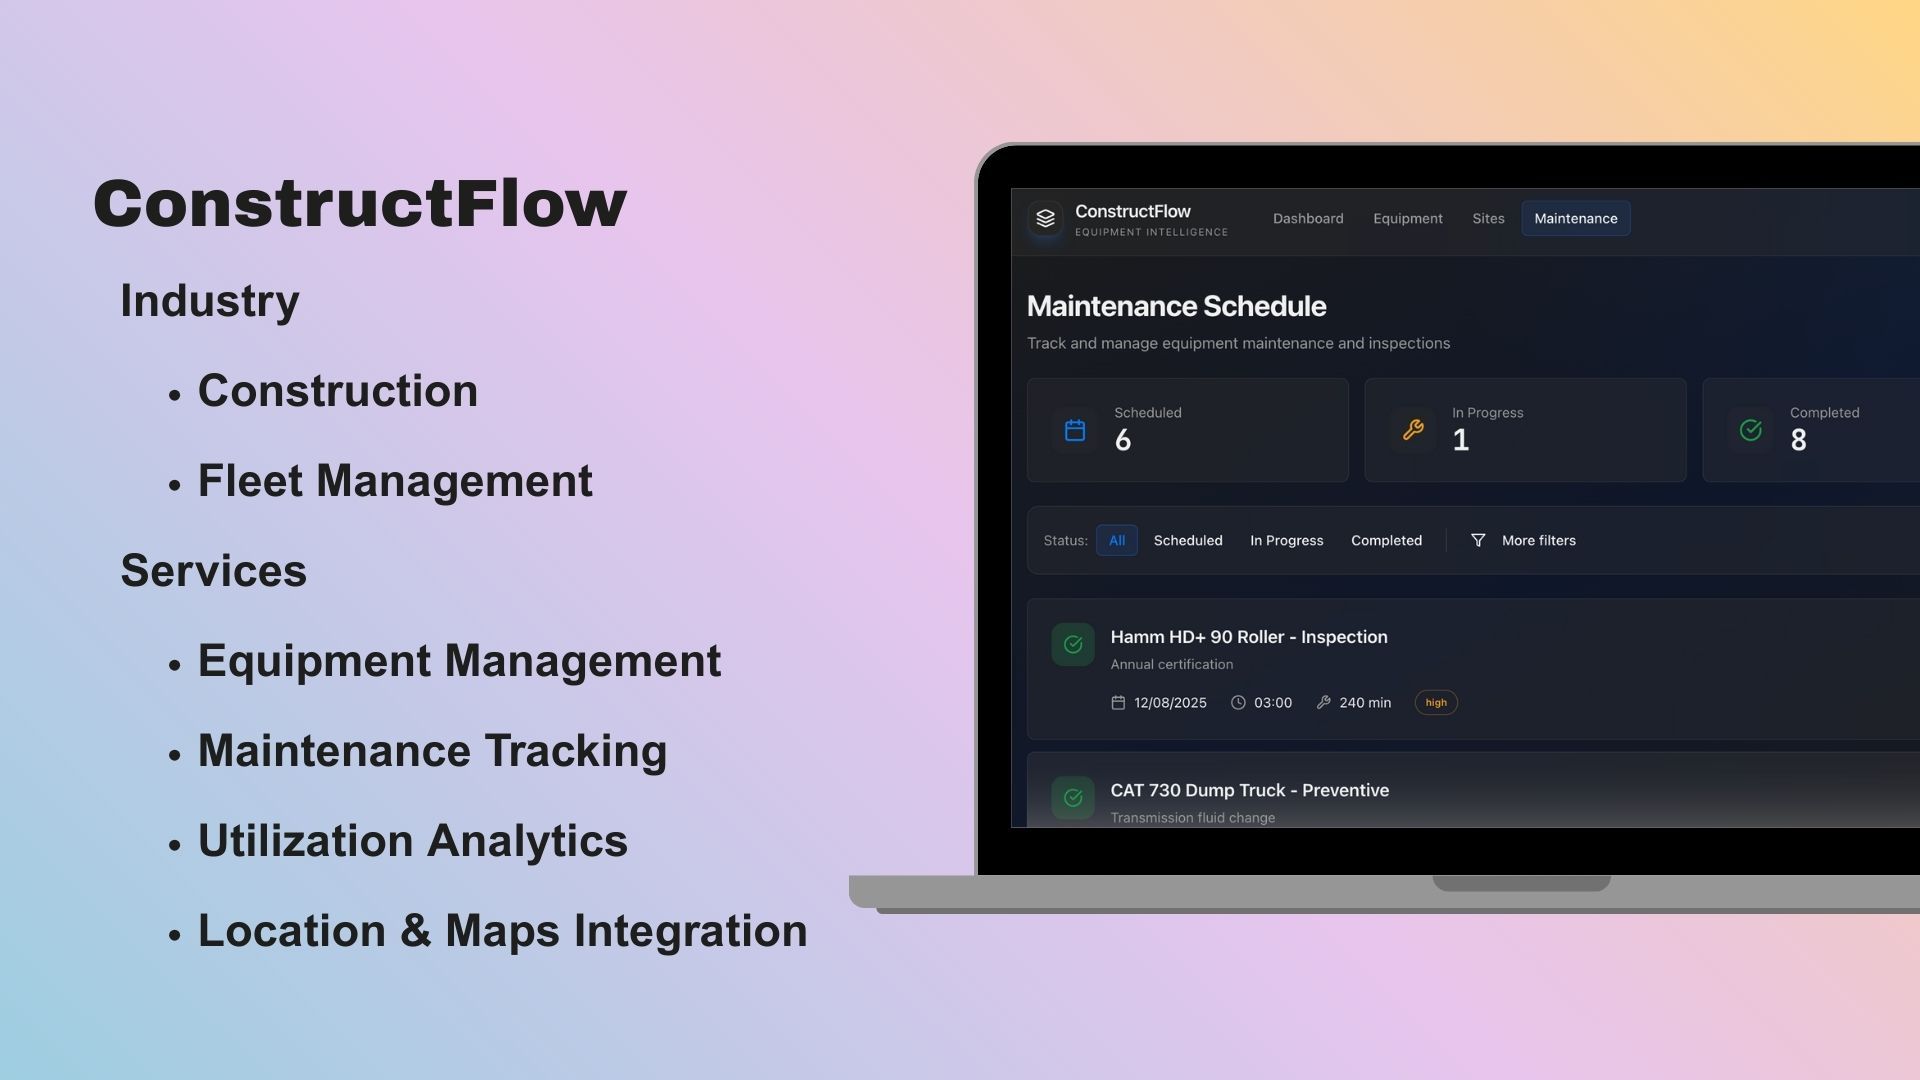
Case StudyConstructFlow
Equipment intelligence platform built with React, Node.js, and PostgreSQL. Provides real-time oversight of construction equipment fleets, maintenance scheduling, cost analytics, and GPS tracking. Manages $5M+ equipment, reduces downtime by 20%, and maintains 99.9% uptime.
About
ConstructFlow is an advanced equipment intelligence platform designed for the construction industry, providing comprehensive oversight of high-value assets. Developed using a modern stack including React, Node.js, and PostgreSQL, the platform enables managers to track a fleet of equipment worth over $5 million, monitor maintenance schedules, and analyze operational costs in real-time. By centralizing equipment data, ConstructFlow helps reduce downtime by up to 20% and provides 99.9% availability for critical operational data.
Features
-
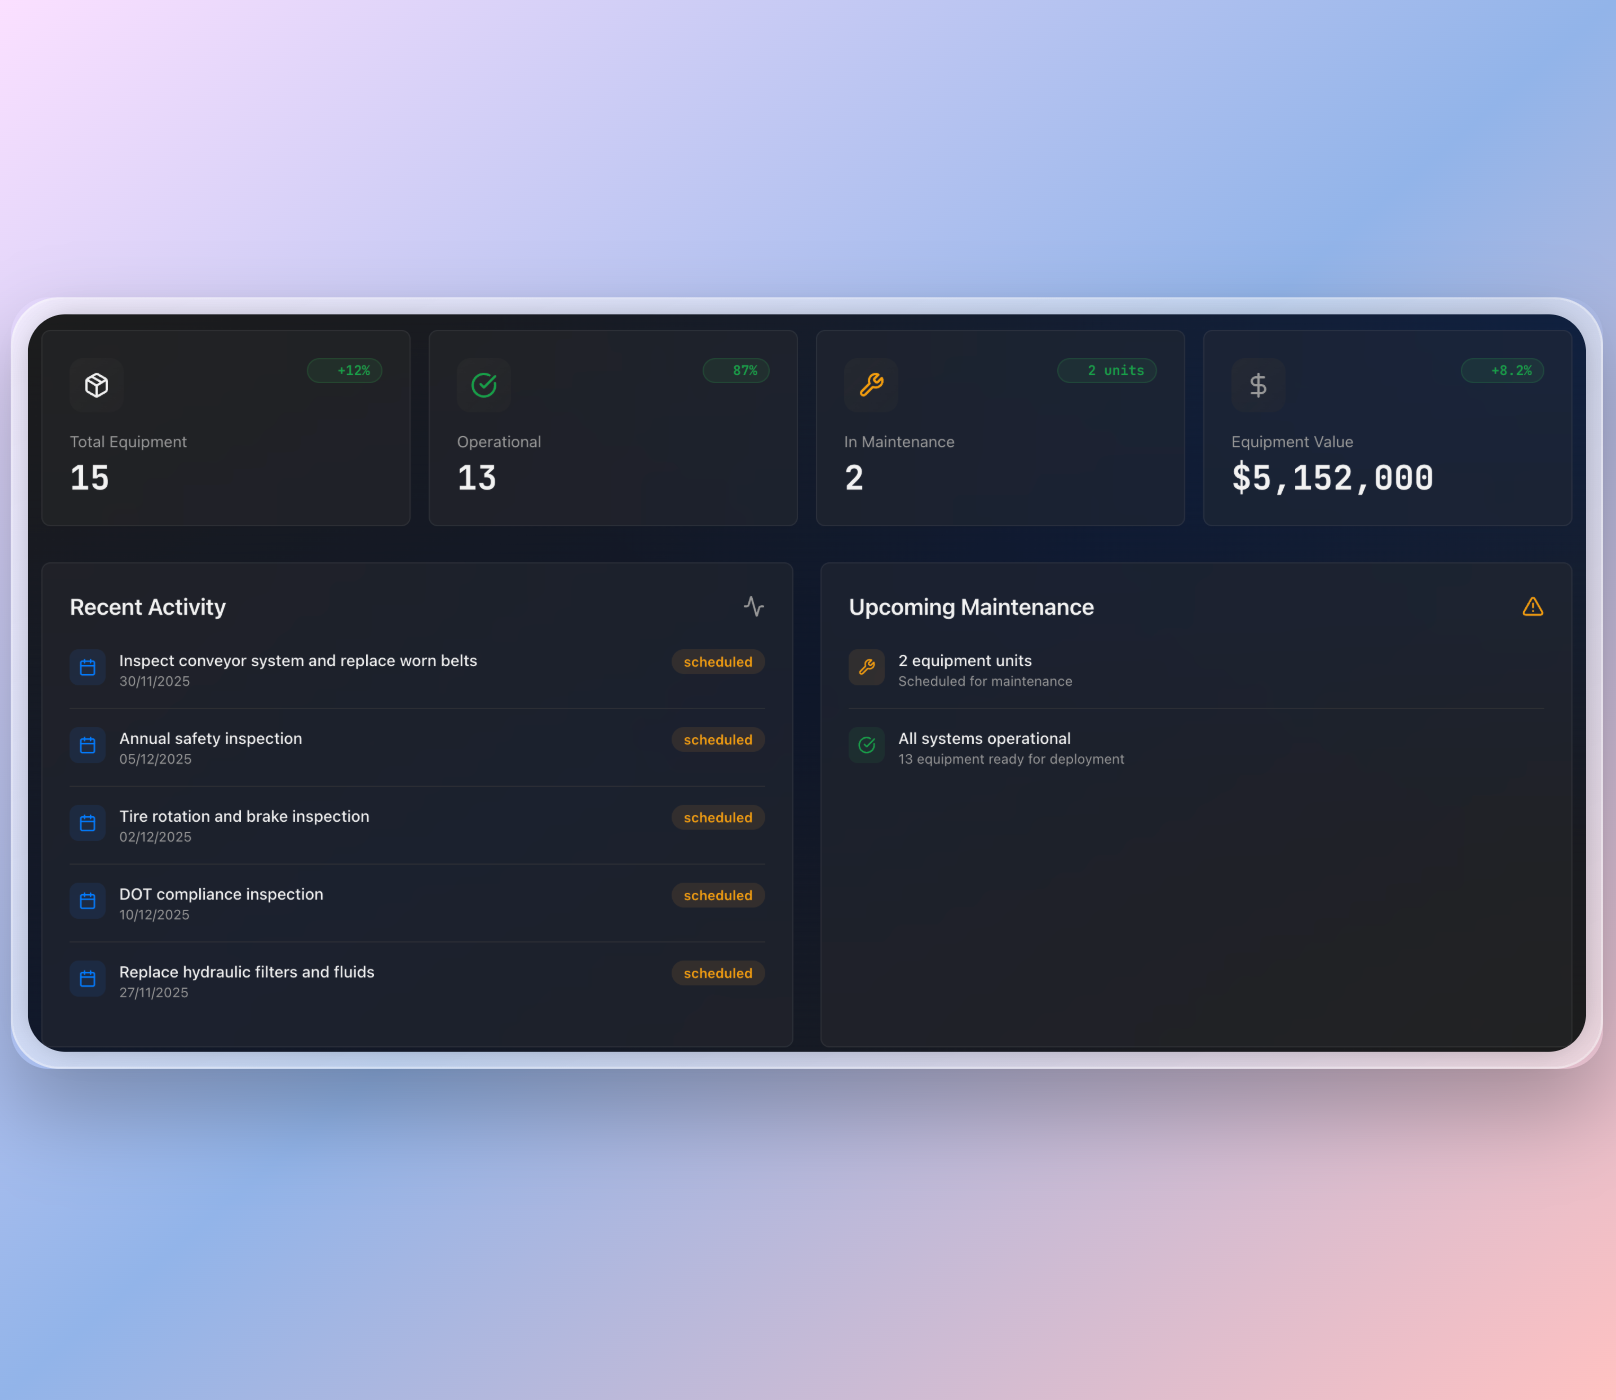
Equipment Intelligence Dashboard
Offers a centralized, real-time overview of the entire equipment fleet. The dashboard displays key metrics such as Total Equipment, Operational Status, and total Equipment Value. It also highlights recent activity and upcoming maintenance, allowing managers to make informed decisions quickly and maintain an operational readiness of over 85%.
-
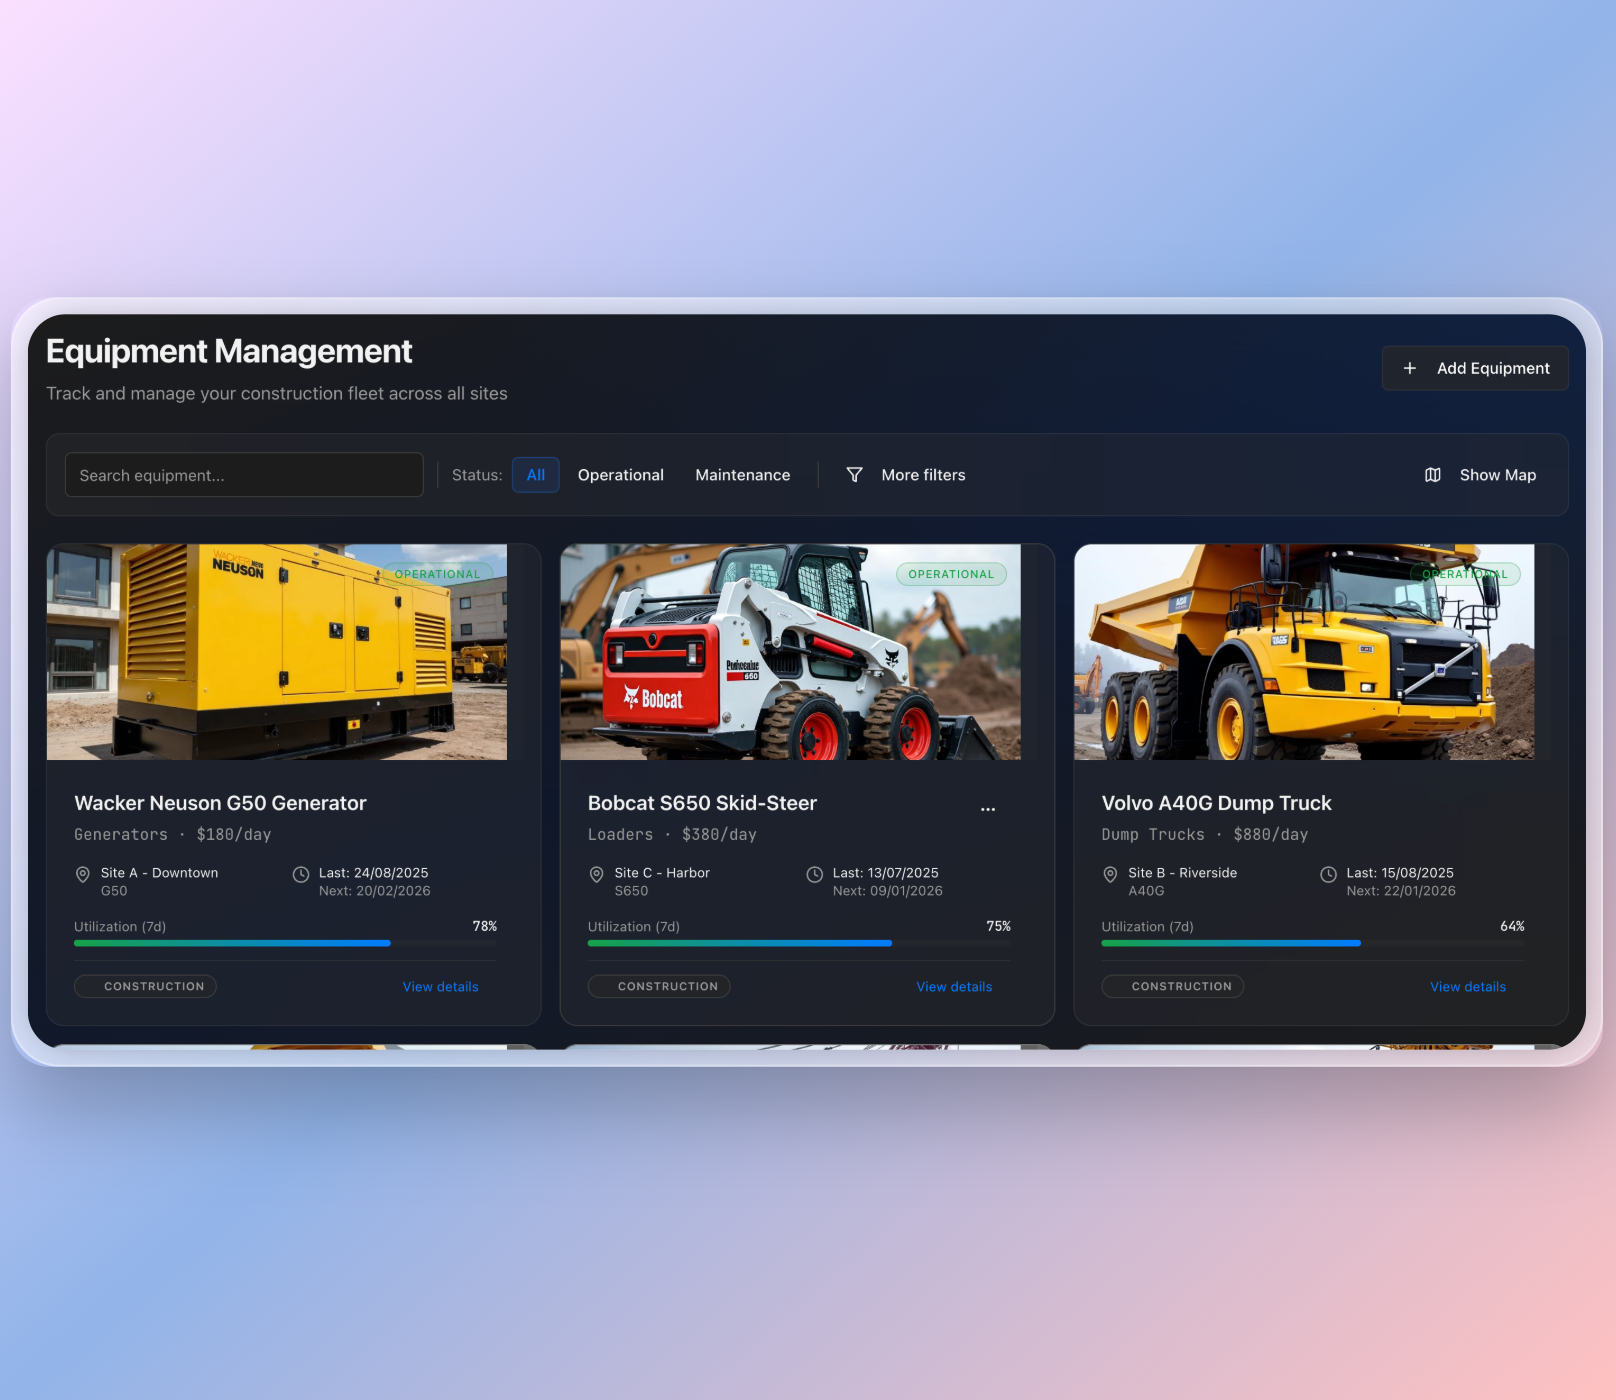
Comprehensive Equipment Management
Provides a detailed inventory of all construction equipment, from generators to heavy machinery. Each piece of equipment has a detailed profile showing its operational status, daily cost, location, and utilization rate. Managers can search and filter the fleet, view maintenance history, and access detailed information to optimize asset allocation and reduce costs by 10-15%.
-
Centralized Construction Site Management
Allows for the management and monitoring of all active construction sites from a single interface. The platform tracks the number of active sites, the total equipment and workers assigned to each, and the average progress toward completion. This feature provides a clear view of resource distribution and project status across the entire portfolio.
-
Proactive Maintenance Scheduling
A dedicated module for tracking and managing all equipment maintenance and inspections. It categorizes tasks by status (Scheduled, In Progress, Completed, Urgent) and provides a clear timeline of all maintenance activities. This proactive approach helps prevent unexpected breakdowns and extends the lifespan of valuable equipment, reducing urgent repair incidents by 30%.
-
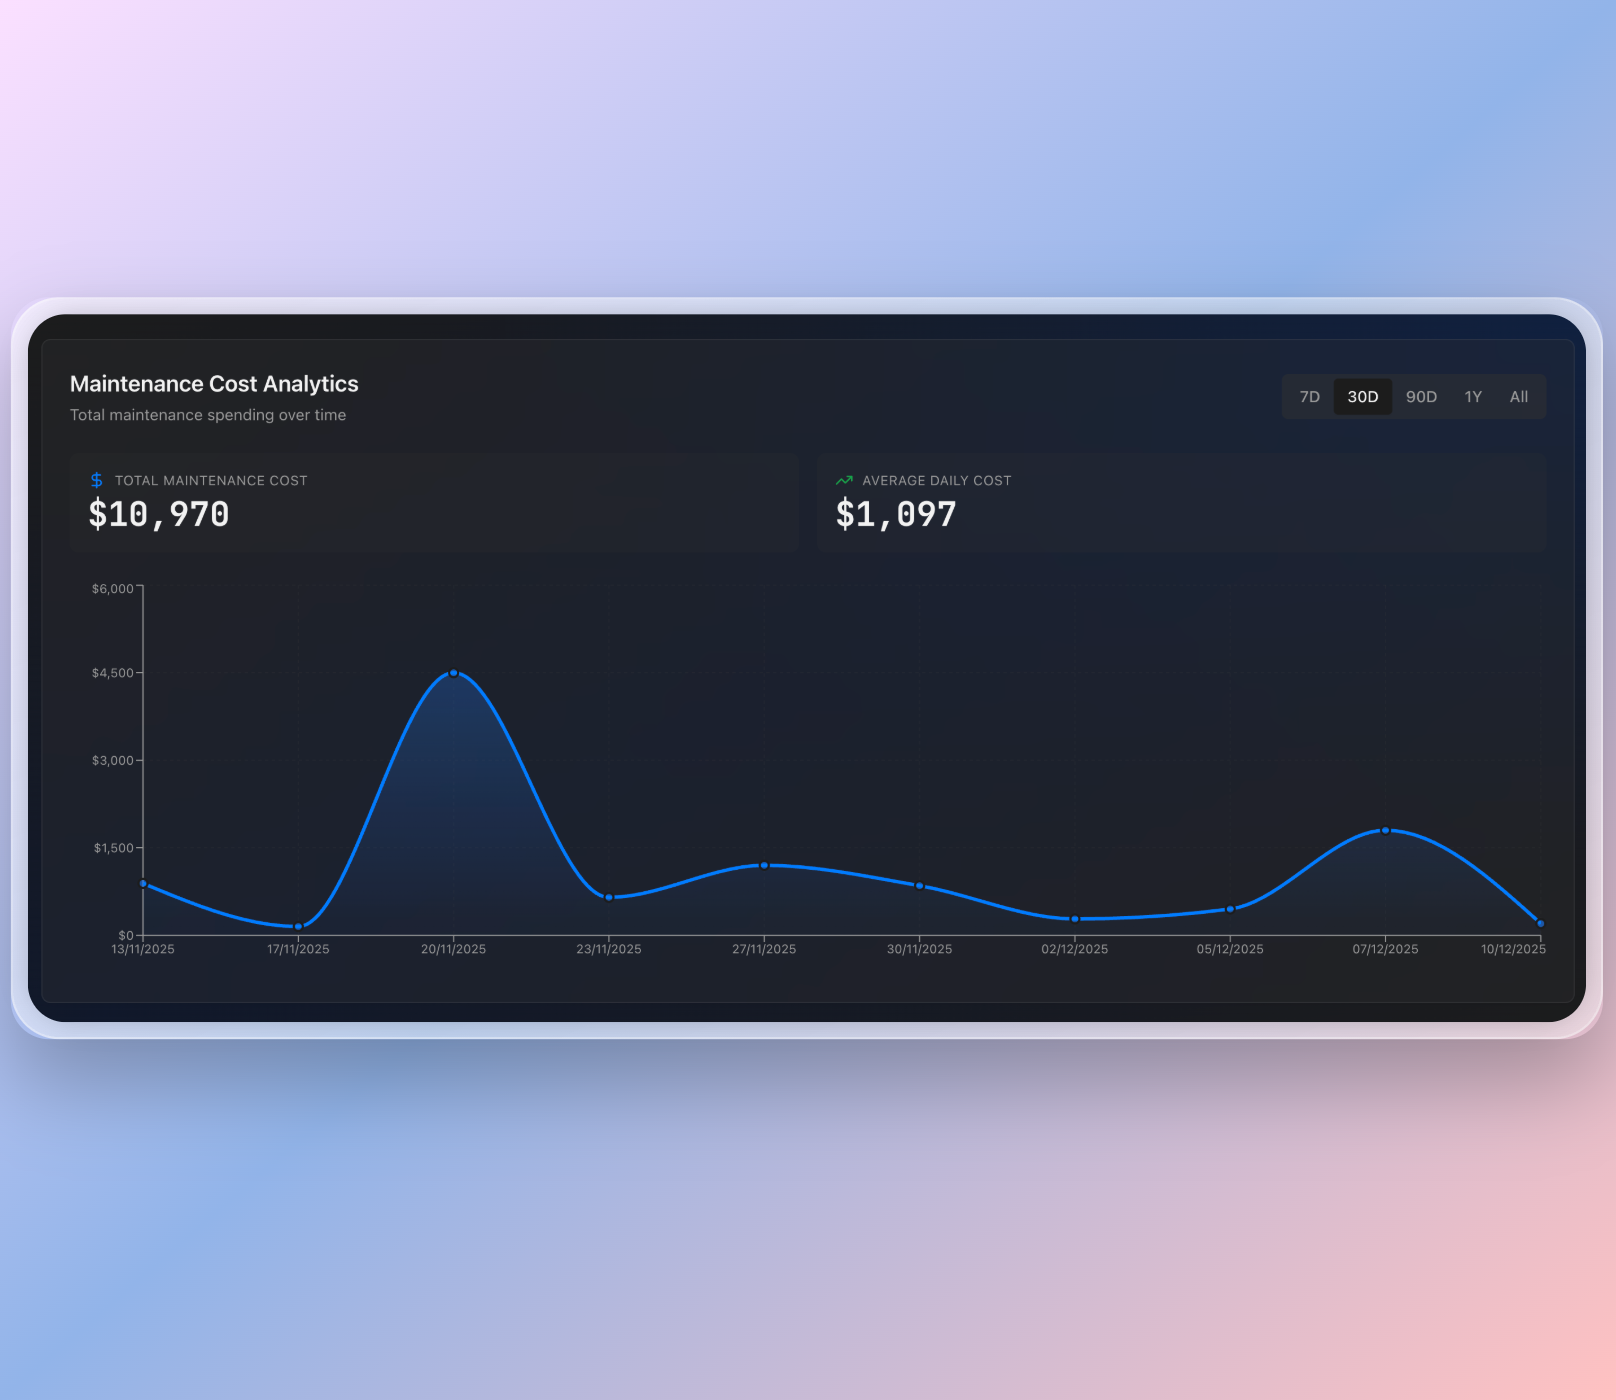
Maintenance Cost Analytics
Visualizes maintenance spending over time with an interactive chart, allowing managers to track Total Maintenance Cost and Average Daily Cost. With filters for 7-day, 30-day, 90-day, and yearly views, this feature helps identify cost trends, budget more accurately, and find opportunities for savings.
-
Real-Time Equipment Location Tracking
Integrates Mapbox to provide real-time GPS tracking of all equipment. Assets are displayed as markers on an interactive map, giving managers a precise, up-to-the-minute view of their fleet’s location. This feature is critical for logistics, security, and ensuring equipment is deployed to the correct site, improving asset security and reducing transportation delays.
Technical Development
Stack
- React (Frontend)
- Node.js (Backend)
- PostgreSQL (Database)
- Redis (Caching)
- Mapbox (Mapping & Geocoding)
- Docker (Containerization)
Dashboard & Analytics
Frontend Implementation: The dashboard is built with React and uses the Recharts library to render dynamic, interactive charts for maintenance cost analytics. Key performance indicators (KPIs) are displayed in a clean, card-based layout using CSS Flexbox. The UI is fully responsive, ensuring a seamless experience on both desktop and mobile devices, with an average component load time of under 100ms.
Backend Implementation: A Node.js and Express.js backend provides a RESTful API to serve aggregated analytics data. The API leverages a Redis cache to store pre-calculated metrics, such as total equipment value and average daily maintenance cost, which are refreshed every 5 minutes. This ensures fast API responses (under 50ms) for the dashboard while reducing the load on the primary database.
Database Design: The PostgreSQL database stores raw data related to equipment and maintenance events. A separate analytics table is used to store time-series data for maintenance costs, partitioned by month for efficient querying. A nightly job aggregates daily costs into this table to power the analytics dashboard.
Equipment & Site Management
Frontend Implementation: The equipment and site management interfaces are built as a single-page application using React. A responsive grid layout built with CSS Grid displays equipment and site cards. A debounced search input allows users to filter results in real-time. Adding or editing equipment and sites is handled through modals with forms managed by React Hook Form for efficient state management and validation.
Backend Implementation: The Node.js backend exposes CRUD endpoints for managing equipment and construction sites. The API includes robust filtering, sorting, and pagination capabilities to handle large datasets. Image uploads for equipment and sites are handled by Multer and stored in an AWS S3 bucket, with the URLs saved in the PostgreSQL database.
Database Design: The database features a equipment table with columns for name, status, cost, and utilization, and a sites table for location and project details. A site_equipment join table creates a many-to-many relationship, allowing equipment to be assigned to multiple sites. Indexes on status, location, and type columns ensure fast query performance.
Maintenance & Scheduling
Frontend Implementation: The maintenance schedule is displayed in a list view, filterable by status. Each maintenance task is a component that shows the task name, date, duration, and priority. A “Schedule Maintenance” button opens a modal with a form for creating new tasks. The form includes a date picker, dropdowns for equipment and task type, and input fields for details.
Backend Implementation: The backend API for maintenance scheduling includes logic to prevent scheduling conflicts and ensure that equipment marked “In Maintenance” is not available for assignment. When a new maintenance task is created, the system can be configured to send email notifications to relevant personnel using Nodemailer. The status of maintenance tasks is updated via dedicated API endpoints.
Database Design: A maintenance_schedule table stores all maintenance tasks, with foreign keys linking to the equipment and users tables. The table includes columns for the scheduled date, completion date, status, priority, and a detailed description of the task. This normalized schema allows for easy tracking of maintenance history for each piece of equipment.

Location Tracking & Mapping
Frontend Implementation: The equipment location feature is powered by React and the react-map-gl library, a wrapper for Mapbox GL JS. The map displays equipment locations as interactive markers. Users can click on a marker to see a popup with details about the equipment. A search bar allows users to find equipment on the map, with autocomplete suggestions provided by the Mapbox Geocoding API.
Backend Implementation: The backend provides a GeoJSON endpoint that serves the geographic coordinates of all equipment to the frontend. When a piece of equipment’s location is updated, the backend uses the Mapbox Geocoding API to convert a physical address into latitude and longitude, which are then stored in the database. The system supports both manual location updates and real-time updates from GPS devices.
Database Design: The equipment table in PostgreSQL is extended with a location column of type geography using the PostGIS extension. This allows for efficient geospatial queries, such as finding all equipment within a 10-mile radius of a specific construction site, with query times of under 100ms.

Deployment
The ConstructFlow platform is fully containerized using Docker for consistency across development and production environments. The React frontend is served from a Vercel deployment, providing global CDN caching and automatic scaling. The Node.js backend is deployed on AWS Elastic Beanstalk, which manages the underlying infrastructure, including load balancing and auto-scaling. The PostgreSQL database is hosted on AWS RDS with Multi-AZ deployment for high availability and automated daily backups. AWS ElastiCache provides the Redis caching layer, and AWS S3 is used for all static asset storage.
Project Details
- Client
- ConstructFlow
- Service
- Business Services
- Date
- November 2025
- Project Duration
- 5 weeks