Case StudyMake IT Run - Business Operations Dashboard
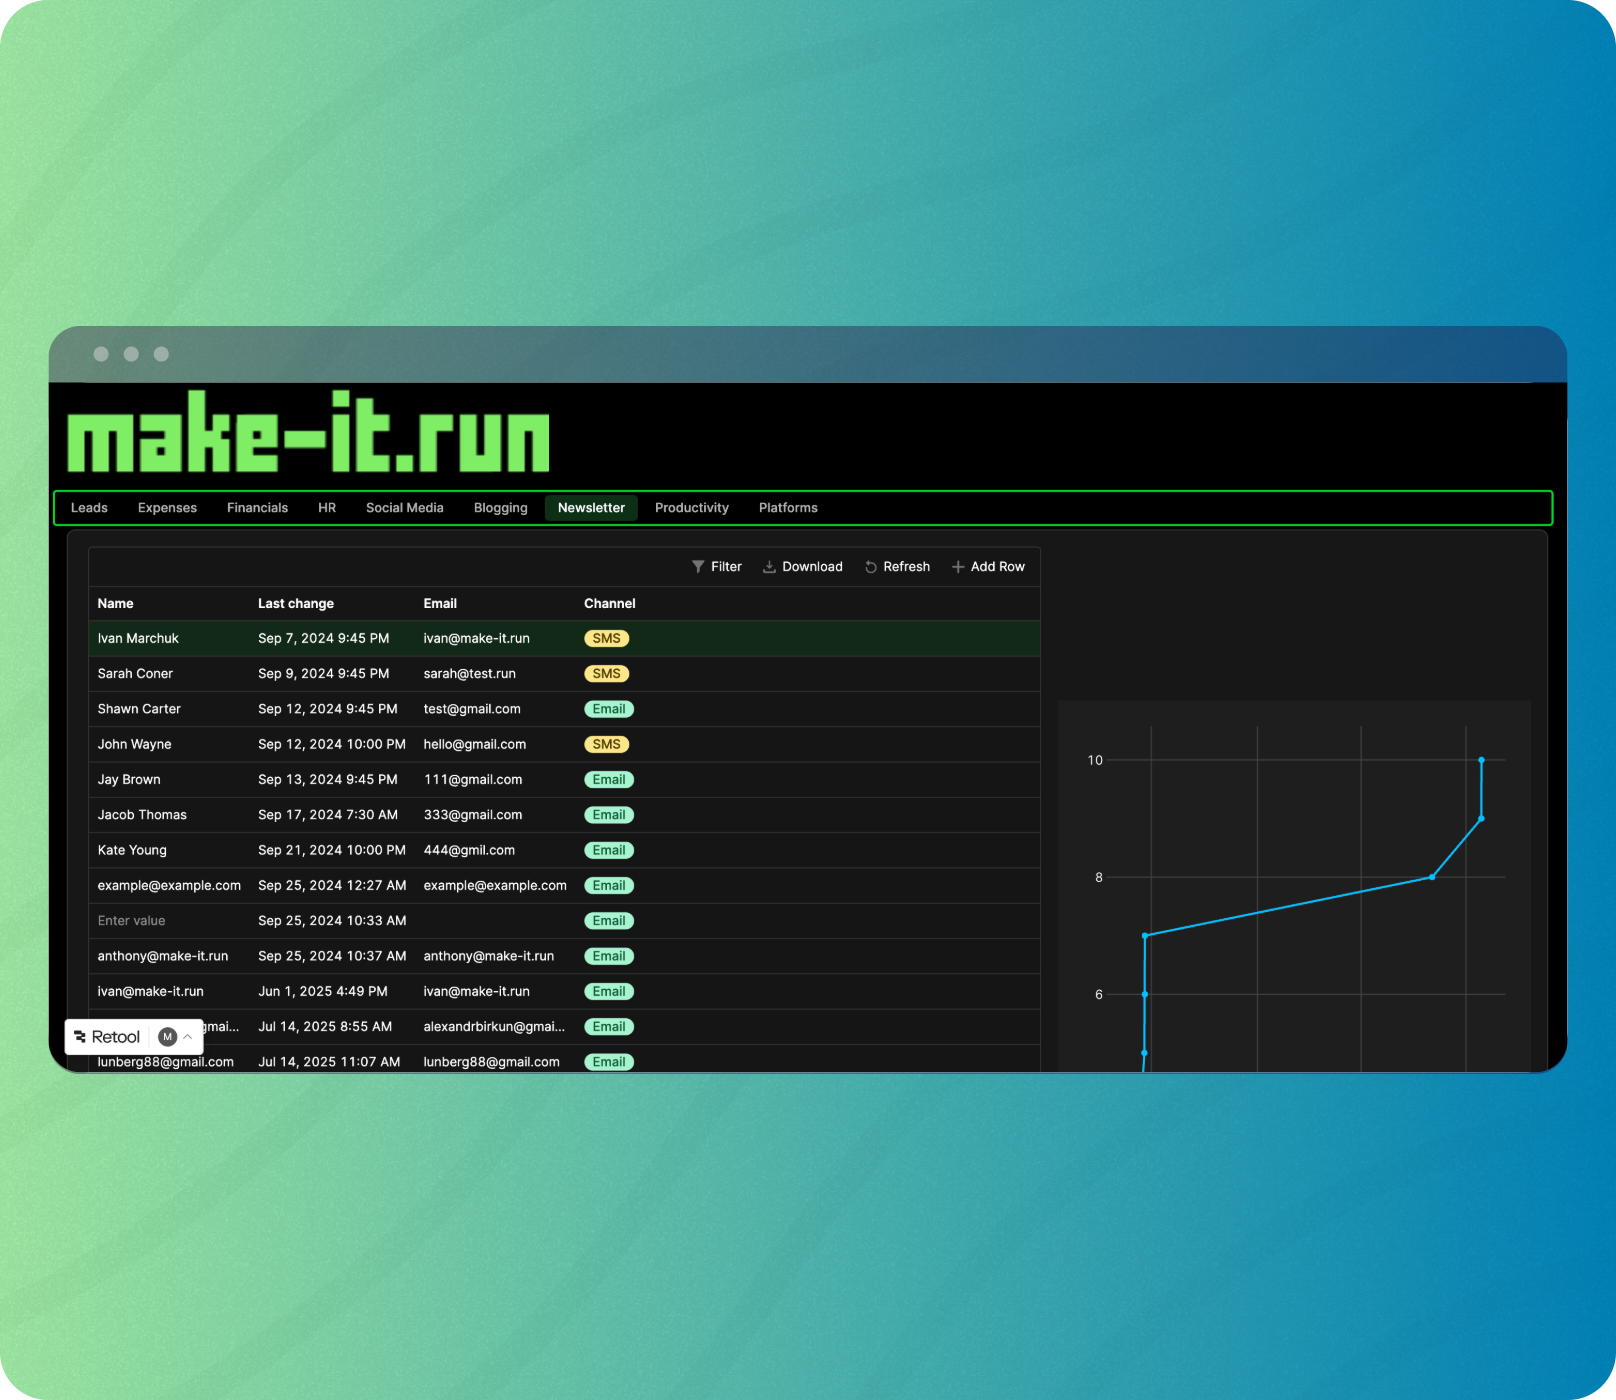
Business dashboard designed to centralize and streamline various operational data streams into a single, unified interface. Developed using Retool, this application provides a comprehensive overview of key business metrics across multiple departments, including sales, marketing, finance, and human resources.

About
Make IT Run needed an internal solution: a “unified app management platform” for clients to monitor deployments, track project progress, manage applications and access analytics. Using third-party tools felt fragmented; the team wanted a branded experience showcasing their technical capabilities. Make IT Run Dashboard became that platform.
Features
- Centralized Control
All client apps in one dashboard for unified management. - Real-Time Monitoring
Deployment status and performance metrics with live updates. - Project Transparency
Progress tracking and communication tools for full visibility. - Self-Service
Clients manage apps independently without support tickets. - White-Label
Branded experience reflecting quality and professionalism.
Challenges & Solutions
- Multi-app management
Unified interface with app switching - Real-time deployment updates
WebSocket connections for live status - Client permissions
Role-based access control - Performance monitoring
Integrated analytics dashboard
Key Features Delivered (v1)
- App portfolio overview
- Deployment pipeline visualization
- Real-time performance metrics
- Project timeline and milestones
- Team collaboration tools
- Documentation hub
- Support ticket system
- Billing and invoicing
“Our own dashboard demonstrates what we build for clients. It’s increased transparency and reduced support requests by 55%.” — Development Team, Make IT Run
Timeline Snapshot
- Week 1-2
Requirements, architecture design - Week 3-6
Core dashboard, app management - Week 7-10
Monitoring, deployment tracking - Week 11-14
Client portal, documentation, launch
Technical Development
- Frontend
React 18, TypeScript, TailwindCSS - Backend
Node.js, PostgreSQL, Redis - Infrastructure
AWS, Docker, Kubernetes - Real-time
WebSockets, Server-Sent Events
What’s Next
- AI-Powered Analytics
- Automated Performance Optimization
- Custom Workflow Builder
Key Takeaways
Make IT Run Dashboard shows how internal tools can become competitive advantages. By building a platform that showcases technical expertise while solving real client needs, we created transparency and efficiency. If you need custom client portals or management platforms, Make IT Run would love to chat.
Project Details
- Client
- Retool
- Date
- September 2025
- Project Duration
- 12 weeks 6 days
Industry
Application Type